Cadila Healthcare | Pharmaceuticals
March 27, 2019
Cadila Healthcare
HOLD
CMP
`338
Corrected but not ripe for investment
Target Price
‘370
Investment Period
12 Months
Cadila Healthcare (Cadila) is on the largest Pharmaceuticals player both in US & Indian
markets. However, over the last few years, the company has been going through tough
times both in USA & Indian markets. While the Indian formulation market has been
under pressure on back of the pricing norms & GST implementation, USA market has
witnessed tougher times by Cadila Healthcare, on back of its Moriya facility coming
Stock Info
Sector
Pharm aceuticals
under USFDA warning letter. However, since then the company has taken steps to
Market Cap (` cr)
34,341
mitigate the risk in its business. The stock has given a correction, to account for the
Net Debt (` cr)
4,017
high business risk; however, it still provides very little comfort for investors. We
Beta
1.0
52 Week High / Low
432/306
recommend a Hold rating on the stock.
Avg. D aily Volum e
45,560
Face Value (`)
1
Growth to be driven by Domestic Business: Cadila’s exports contributed
BSE Sensex
38,233
around 59% to its FY2018 sales. Company has established a formidable presence in
Nifty
11,483
the developed markets of US, Europe (France and Spain) and ROW. USA exports are
Reuters Code
CADI.BO
Bloomberg Code
CDH.IN
expected to post a CAGR of 1.4% over FY2018-21E, driven by new product launches
and more focused launches in injectable, Transdermal and Specialty segments. Overall,
Shareholding Pattern (%)
we have built in an export sales CAGR of 2.3% over FY2018-21E. In the domestic
Prom oters
74.8
market, it plans to perk-up its productivity levels, along with aggressively launching
MF / Banks / Indian Fls
10.6
FII / NRIs / OCBs
8.4
new products, which will keep the momentum steady. We have conservatively
Indian Public / Others
6.2
forecasted the formulation business to post a CAGR of 9.5% CAGR during the FY2018-
21E. Apart from Domestic formulation business, the company has a strong consumer
Abs .(%)
3m
1 yr
3 yr
division, which contributed ~4% of sales in FY2018. After the Heinz acquisition,
Sensex
6.8
15.6
53.1
company’s wellness segment will contribute around 12% by FY2020. Over FY2018-21E,
Cadila Healthcare
(1.0)
(13.9)
5.2
the segment is expected to post a CAGR of 62.0% during the period.
Valuations & Outlook: Over FY2018-21E, the company expects to post a sales
and net profit CAGR of 9.1% and a flat growth during FY2018-21E respectively.
Company’s stock has witnessed a correction & however given the challenges, at
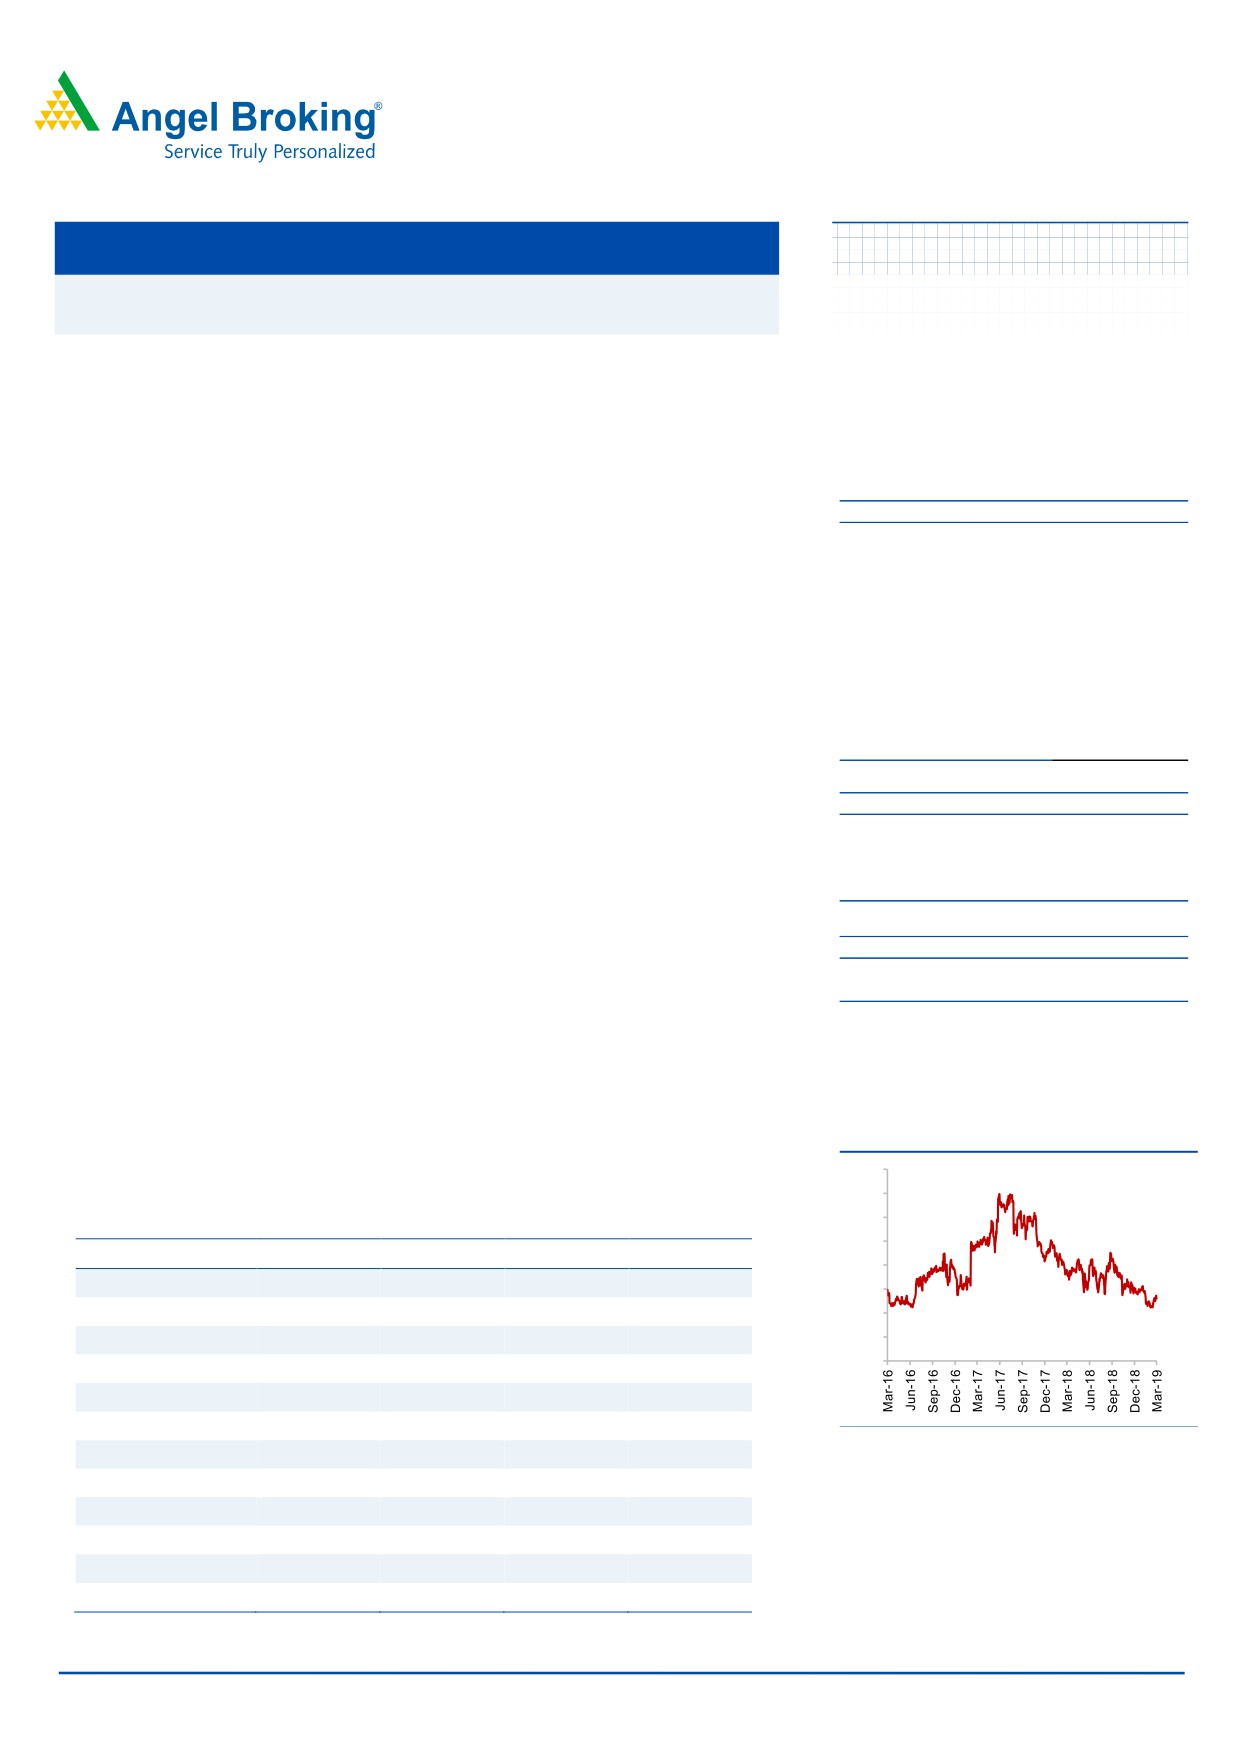
3-Year Daily Price Chart
current valuations the stock provides very little upside. Hence, we have factored in
600
the same to recommend a Hold.
550
500
Key financials (Consolidated)
450
Y/E March (` cr)
FY2018
FY2019E
FY2020E
FY2021E
400
Net sales
11,599
12,624
14,063
15,055
350
% chg
25.8
8.8
11.4
7.0
300
Net profit
1,776
1,773
1,708
1,653
250
200
% chg
19.4
(0.2)
(3.6)
(3.3)
EBITDA margin (%)
21.8
20.4
19.1
17.9
EPS (`)
17.3
17.3
16.7
16.1
Source: Company, Angel Research
P/E (x)
19.5
19.5
20.2
20.9
P/BV (x)
4.0
3.5
3.1
2.8
RoE (%)
22.6
18.9
16.1
14.0
RoCE (%)
15.6
12.9
11.7
10.6
Sarabjit kour Nangra
EV/Sales (x)
3.3
3.2
2.9
2.6
+91 22 3935 7800 Ext: 6806
EV/EBITDA (x)
15.1
15.6
15.0
14.3
sarabjit @angelbroking.com
Source: Company, Angel Research; Note: CMP as of March 26, 2019
Please refer to important disclosures at the end of this report
1
Cadila Healthcare | Pharmaceuticals
Exports; expected to be lackluster
Cadila has a two-fold focus on exports (which contributed around 59% to its FY2018
top-line), wherein it is targeting developed as well as emerging markets. The company
has established a formidable presence in the developed markets of US, Europe (France
and Spain) and Japan. In the US, the company achieved critical scale of `5,834cr
(US$900mn) on the sales front in FY2018. The growth in exports to the USA along with
other regions like ROW would be driven by new product launches, going forward.
USA sales visibility better than earlier; but product concentration still high
USA is the key export market for the company, contributing 50% of overall sales. The
company registered a CAGR growth of 28% during FY2014-2018 in the region. It is the
8 th largest generic pharmaceutical company in US by Prescription Share & company’s
65% of portfolio occupy Top 3 position in the US generic prescription market (IQVIA
SMART NPA Generic TRx MAT October 2018). In addition, the company is amongst the
company with largest and diversify product pipeline for the USA market. As on 31st
Dec’2018, the company had overall 352 ANDA’s with around 215 ANDA is pending
approval. With around 15-20 ANDA’s expected to be approved annually, implies the
region can grow easily at 15-20% CAGR for next 4-5 years.
Cadila Healthcare in spite of being one of the top ANDA filer in the USA market (third,
after Sun Pharma & Aurobindo Pharma), had seen a rough patch in USA markets; when
its biggest facility Moriya plant went through USFDA inspection and import alert. The
sales from that plant contributed around 60% of its USA sales then. However, after
FY2017; the situation improved for the company as the plant got the clean chit. Thus,
since FY2018, USA sales of the company has improved on back of niche opportunities
and new product launches. Going into future, company in the near future i.e
FY2019/2020, should witness a slew of launches. For FY2019/2020, company is expected
to launch 50 and 40 products respectively. However, given that most of its niche
launches would face competitive pressures & new launches, overall the USA sales is
unlikely to witness significant growth. In terms of de-risking its filings and reducing the
USFDA event risk, the company since its experience with Moriya plant has built further
manufacturing facilities like Ahmedabad SEZ, Baddi & has acquired the Windlas facility.
As per Management now, Moriya accounts only for 18% of pending approvals.
In terms, of nature of fillings, the company has diversified filings across the therapeutic
segments. Key therapeutic segments which will drive its growth in USA over next 3-4
years, would be injectable, Transdermal and Specialty. While the company has products
being developed in-house for the former two categories, in specialty the company as
acquired Sentynl Therapeutics, which had sales of US$70mn in FY2018, contributing
10% of USA sales. The profitability of the company is very high with net margins of 37%.
As per Specialty segment, company plans to expand the same lead by acquisition
strategy. Overall USA exports are expected to post a CAGR of 1.4% over FY2018-21E.
This is mainly on back of the base effect of FY2018, where key niche opportunities like
gLiada, gAsacol HD and to some extent by gTamiflu capsules. These products according
to us would have contributed around ~40% of its sales in FY2018. This is the main
reason, that Cadila HealthCare’s USA business will report flat sales inspite of new
launches. Going forward, the growth In USA is highly dependent upon the new product
launches. Thus, while company has taken steps to diversify its fillings facility and
segment wise to arrest any major impact on USA sales. Excluding the niche
March 25, 2019
2
Cadila Healthcare | Pharmaceuticals
opportunities, the USA business is expected to register a growth of 10.0% during
FY2018-21E.
ROW exports to be driven by Vaccines & biologicals; Europe still to pickup
Apart from USA, company has good presence in Europe & ROW (Emerging Markets &
Brazil). Historically over FY2014-2017, the company saw European sales dip at a CAGR
of 12.4%, while Brazil & Emerging markets during the period posted a CAGR of 1.3%
and 11.2% respectively. Going forward, for ROW, the company has chalked out a
strategy to supply Biotech & Vaccines to the key growth drivers in the region. Company
expects these two product categories to register sales of US$ 200mn over next 4-5 years.
Going into FY2018-21E, we expect regions like Brazil & Emerging markets to grow at a
CAGR of 9.0% respectively. European region, we believe will remain lackluster. Overall,
we have built in an export sales CAGR of 2.3% over FY2018-21E.
Domestic portfolio; Focusing on growth levers
Cadila is the fourth largest player in the domestic market with sales of about `3,332cr in
FY2018; the domestic market contributed ~29% to its top-line. The company enjoys a
leadership position in the CVS, GI, women healthcare and respiratory segments, and has
a sales force of 6,000+ Field Force. Over FY2014-2018, Formulation sales grew by 7.8%
CAGR, which aided a 7.6% CAGR in overall domestic sales. Cadila Healthcare, historically
grown lower than the Indian Industry growth rate of 11-12% CAGR during the period.
One of prime reason behind the same has been high concentration of old mature
products, which still forms 22-25% of the domestic formulation business. This has also
kept the Cadila’s field productivity low at around 40-45lacs. Going forward, company
plans to perk-up its productivity levels and expects it to reach 60lacs in next few years.
Along with this company has been aggressively launching new products, which will keep
the momentum steady. We have conservatively forecasted the formulation business to
post a CAGR of 9.5% CAGR during the FY2018-21E.
Apart from Domestic formulation business, the company has a strong consumer division
through its stake in Zydus Wellness, which has premium brands such as Sugarfree,
Everyuth and Nutralite under its umbrella. This segment, which contributed ~4% of sales
in FY2018, registering a growth of 3.4% during FY2014-2018. However, after the Heinz
acquisition during 3QFY2019; company’s wellness segment will contribute around 12%
by FY2020.
With this Cadila gets Glucon-D, Nycil and Sampriti Ghee (Global rights), Complan (rights
for India, Bangladesh, Nepal and those countries where seller has IP rights). Amongst
the brands to be, acquired Glucon-D is the largest one and both Glucon-D and Nycil
have been growing faster than the market growth rate. Heinz India has sales of
`11,.500cr with EBITDA of `225cr for 12months of June’2018. This is largely domestic
sales with small exports. The company has been acquired at the cost of `4,595cr to be
funded in cash along with a combination of debt and equity. Overall, the management
indicated that transaction is likely to be funded 2/3rd by equity and the balance 1/3rd
by debt (has an interest cost of 9.4%). Company plans further infusion of around `1000-
`1200cr.
March 25, 2019
3
Cadila Healthcare | Pharmaceuticals
Over FY2018-21E, the segment is expected to post a CAGR of 62.0% during the period,
contributing 12% of overall sales by FY2020. Overall, FY2018-21E, we expect the
domestic segment to grow at a CAGR of 19.1%.
Valuations & Outlook
Cadila Healthcare has been one of the steady companies in the Indian Pharmaceutical
Industry; in spite of all the challenges. Over FY2011-18E, the company has witnessed a
sales growth of 14.6%; while net profit has registered a growth of 14.0%. EBDITA margins
of the company has been steady at around 18-19%.
Going forward, as company moves along with the iIndustry into the next leg of the
transition; where more complex and specialty products along with normal generic-
generic products will dominate the growth drivers of most of the companies. Thus M&A
along with investments in R&D could witness a pump-up. Hence, we are going selective
in the space; given these product categories are going to be complex. In addition, given
the regulatory risks involved in the business from both USA markets & domestic
markets, we expect few companies to cruise through the new challenges.
Cadila Healthcare has built in blocks to make that transition smooth, by putting a
strategy to diversifying its USA business in terms of both fillings (plant-wise) & product
launches. Hence, over FY2018-21E, the company expects to post a sales and net profit
CAGR of 9.1% and flattish growth during the FY2018-21E respectively. However, on
negative side the ROIC of the company is around 17%; with D/E of 0.6xFY2019E. Given
that, the generic pharmaceutical business is a price sensitive business & requires a lot
of discipline for the players to deliver consistently over a period. Cadila Healthcare has
been one of such players and future pharmaceuticals business will demand more R&D
expenses & strong balance sheets. While Cadila Healthcare, scores over its peers in
many factors like diversified big ANDA pipeline, disciplined approach to R&D
investments, strong control on expenses, its’ domestic business lacks its peers in terms
of growth and other key parameters. Further, its concentration in its key markets like
USA & Indian is a risk. This we have witnessed in the stock performance of the company.
Thus while, the dip has provided some relief, we believe at this juncture the stock given
the challenges, at current valuations provides very little upside. Hence, we have
factored in the same to recommend a Hold.
Company Background
Zydus Cadila, a leading Indian Pharmaceutical company is a fully integrated, global
healthcare provider. With in-depth domain expertise in the field of healthcare, it has
strong capabilities across the spectrum of the pharmaceutical value chain. From
formulations to active pharmaceutical ingredients and animal healthcare products to
wellness products, Zydus has earned a reputation amongst Indian pharmaceutical
companies for providing comprehensive and complete healthcare solutions. Having
already achieved the US$1bn sales mark in 2011, the company aims to be a research-
driven pharmaceutical company by 2020.
March 25, 2019
4
Cadila Healthcare | Pharmaceuticals
Profit & Loss statement (Consolidated)
Y/E March (` cr)
FY2016
FY2017
FY2018
FY2019E
FY2020E
FY2021E
Gross sales
9,262
9,416
11,631
12,658
14,109
15,105
Less: Excise duty
190
196
32
34
46
50
Net sales
9,072
9,220
11,599
12,624
14,063
15,055
Other operating income
355
210
306
406
406
406
Total operating income
9,427
9,430
11,905
13,030
14,469
15,460
% chg
9.0
0.0
26.3
9.5
11.0
6.8
Total expenditure
7,099
7,526
9,076
10,047
11,380
12,354
Net raw materials
3,096
3,445
4,437
4,829
5,379
5,721
Other mfg costs
570
579
729
631
703
753
Personnel
1,262
1,500
1,855
2,188
2,626
3,020
R&D Expenses
726
754
942
1,010
1,125
1,204
Other
1,446
1,248
1,114
1,389
1,547
1,656
EBITDA
1,973
1,694
2,523
2,577
2,683
2,701
% chg
23.2
(14.2)
49.0
2.2
4.1
0.7
(% of Net Sales)
21.7
18.4
21.8
20.4
19.1
17.9
Depreciation& amortization
292
375
539
690
770
850
EBIT
1,681
1,319
1,984
1,887
1,913
1,850
% chg
27.9
(21.5)
50.5
-4.9
1.4
-3.2
(% of Net Sales)
18.5
14.3
17.1
14.9
13.6
12.3
Interest & other charges
53
45
91
167
198
210
Other income
116
129
113
200
120
120
(% of PBT)
6
8
5
9
5
6
Recurring PBT
2,099
1,612
2,312
2,326
2,240
2,166
% chg
44.1
(23.2)
43.4
0.6
(3.7)
(3.3)
Extraordinary expense/(Inc.)
2
-
-
0
0
0
PBT (reported)
2,099
1,612
2,312
2,326
2,240
2,166
Tax
177.4
128.9
564.4
581.5
560.0
541.5
(% of PBT)
8.5
8.0
24.4
25.0
25.0
25.0
PAT (reported)
1,921
1,483
1,747
1,744
1,680
1,624
Less: Minority interest (MI)
30.0
29.1
(28.2)
(28.2)
(28.2)
(28.2)
PAT after MI (reported)
1,934
1,488
1,776
1,773
1,708
1,653
ADJ. PAT
1,936
1,488
1,776
1,773
1,708
1,653
% chg
67.0
(23.2)
19.4
(0.2)
(3.6)
(3.3)
Basic EPS (`)
18.9
14.5
17.3
17.3
16.7
16.1
March 25, 2019
5
Cadila Healthcare | Pharmaceuticals
Balance Sheet (Consolidated)
Y/E March (` cr)
FY2016 FY2017 FY2018 FY2019E FY2020E FY2021E
SOURCES OF FUNDS
Equity share capital
102
102
102
102
102
102
Reserves & Surplus
5,597
6,858
8,642
9,896
11,105
12,274
Shareholders funds
5,699
6,960
8,746
10,001
11,210
12,381
Minority interest
135
156
191
163
135
106
Total loans
2,107
4,945
5,113
6,000
6,000
6,000
Other Long Term Liabilities
61
45
64
47
48
49
Long Term Provisions
97
169
156
156
156
156
Deferred tax liability
(318)
(401)
(643)
(643)
(643)
(643)
Total liabilities
7,782
11,875
13,626
15,724
16,906
18,049
APPLICATION OF FUNDS
Gross block
4,786
5,436
8,131
9,131
10,131
11,131
Less: Acc. depreciation
2,120
2,495
3,033
3,724
4,494
5,345
Net block
2,666
3,942
5,097
5,407
5,636
5,786
Capital Work-in-Progress
892
892
1,527
1,527
1,527
1,527
Goodwill
1,141
2,465
1,385
1,385
1,385
1,385
Investments
416
435
746
3,375
3,845
3,124
Long Term Loans and Adv.
836
997
460
460
460
460
Current assets
4,081
5,973
7,926
7,395
8,314
10,329
Cash
639
1,544
1,315
160
129
1,607
Loans & advances
335
336
337
407
578
579
Other
3,108
4,094
6,274
6,828
7,607
8,143
Current liabilities
2,250
2,829
3,515
3,825
4,261
4,562
Net Current assets
1,831
3,144
4,411
3,570
4,052
5,767
Mis. Exp. not written off
-
-
-
-
-
Total assets
7,782
11,875
13,626
15,724
16,906
18,049
March 25, 2019
6
Cadila Healthcare | Pharmaceuticals
Cash Flow Statement (Consolidated)
Y/E March (` cr)
FY2016 FY2017 FY2018 FY2019 FY2020E FY2021E
Profit before tax
2,099
1,612
2,312
2,326
2,240
2,166
Depreciation
292
375
539
690
770
850
(Inc)/Dec in Working Cap.
(37)
(570)
(957)
(314)
(513)
(237)
Less: Other income
116
129
113
200
120
120
Direct taxes paid
177
129
564
581
560
541
Cash Flow from Operations
2,061
1,160
1,216
1,921
1,817
2,118
(Inc.)/Dec.in Fixed Assets
(433)
(650)
(3,331)
(1,000)
(1,000)
(1,000)
(Inc.)/Dec. in Investments
(262)
(19)
(311)
(2,629)
(470)
721
Other income
116
129
113
200
120
120
Cash Flow from Investing
(579)
(540)
(3,529)
(3,429)
(1,350)
(159)
Issue of Equity
-
-
-
-
-
-
Inc./(Dec.) in loans
(222)
2,894
173
870
1
1
Dividend Paid (Incl. Tax)
(572)
(327)
(419)
(518)
(500)
(483)
Others
(589)
(2,431)
1,804
479
1
1
Cash Flow from Financing
(1,383)
136
1,557
831
(498)
(482)
Inc./(Dec.) in Cash
99
756
(756)
(677)
(31)
1,477
Opening Cash balances
738
837
1,593
837
160
129
Closing Cash balances
837
1,593
837
160
129
1,607
March 25, 2019
7
Cadila Healthcare | Pharmaceuticals
Key Ratios
Y/E March
FY2016 FY2017 FY2018 FY2019 FY2020E FY2021E
Valuation Ratio (x)
P/E (on FDEPS)
17.9
23.2
19.5
19.5
20.2
20.9
P/CEPS
15.5
18.5
14.9
14.0
13.9
13.8
P/BV
6.1
5.0
4.0
3.5
3.1
2.8
Dividend yield (%)
0.9
1.0
1.0
1.3
1.2
1.2
EV/Sales
3.9
4.0
3.3
3.2
2.9
2.6
EV/EBITDA
17.9
21.9
15.1
15.6
15.0
14.3
EV / Total Assets
4.5
3.1
2.8
2.5
2.4
2.1
Per Share Data (`)
EPS (Basic)
18.9
14.5
17.3
17.3
16.7
16.1
EPS (fully diluted)
18.9
14.5
17.3
17.3
16.7
16.1
Cash EPS
21.8
18.2
22.7
24.1
24.3
24.5
DPS
3.2
3.5
3.5
4.3
4.2
4.0
Book Value
55.7
68.0
85.4
97.7
109.5
120.9
Dupont Analysis
EBIT margin
18.5
14.3
17.1
14.9
13.6
12.3
Tax retention ratio
91.5
92.0
75.6
75.0
75.0
75.0
Asset turnover (x)
1.4
1.1
1.1
0.9
0.9
0.9
ROIC (Post-tax)
23.8
14.2
13.6
10.5
9.1
8.6
Cost of Debt (Post Tax)
2.2
1.2
1.4
2.3
2.5
2.6
Leverage (x)
0.3
0.4
0.5
0.5
0.6
0.4
Operating ROE
30.8
19.1
19.2
14.7
12.8
11.2
Returns (%)
ROCE (Pre-tax)
22.8
13.4
15.6
12.9
11.7
10.6
Angel ROIC (Pre-tax)
34.4
21.8
24.2
17.1
14.4
13.5
ROE
38.9
23.5
22.6
18.9
16.1
14.0
Turnover ratios (x)
Asset Turnover (Gr. Block)
2.1
1.8
1.8
1.5
1.5
1.5
Inventory / Sales (days)
56
61
64
54
55
63
Receivables (days)
65
78
84
71
72
84
Payables (days)
83
105
112
61
60
59
WC (ex-cash) (days)
49
54
72
91
92
95
Solvency ratios (x)
Net debt to equity
0.3
0.5
0.4
0.6
0.5
0.4
Net debt to EBITDA
0.7
2.0
1.5
2.3
2.2
1.6
Int. Coverage (EBIT / Int.)
31.8
29.3
21.8
11.3
9.7
8.8
March 25, 2019
8
Cadila Healthcare | Pharmaceuticals
Research Team Tel: 022 - 39357800
DISCLAIMER
Angel Broking Limited (hereinafter referred to as “Angel”) is a registered Member of National Stock Exchange of India Limited, Bombay
Stock Exchange Limited, Metropolitan Stock Exchange Limited, Multi Commodity Exchange of India Ltd and National Commodity &
Derivatives Exchange Ltd It is also registered as a Depository Participant with CDSL and Portfolio Manager and Investment Adviser with
SEBI. It also has registration with AMFI as a Mutual Fund Distributor. Angel Broking Limited is a registered entity with SEBI for Research
Analyst in terms of SEBI (Research Analyst) Regulations, 2014 vide registration number INH000000164. Angel or its associates has not
been debarred/ suspended by SEBI or any other regulatory authority for accessing /dealing in securities Market. Angel or its
associates/analyst has not received any compensation / managed or co-managed public offering of securities of the company covered
by Analyst during the past twelve months.
This document is solely for the personal information of the recipient, and must not be singularly used as the basis of any investment
decision. Nothing in this document should be construed as investment or financial advice. Each recipient of this document should make
such investigations as they deem necessary to arrive at an independent evaluation of an investment in the securities of the companies
referred to in this document (including the merits and risks involved), and should consult their own advisors to determine the merits
and risks of such an investment.
Reports based on technical and derivative analysis center on studying charts of a stock's price movement, outstanding positions and
trading volume, as opposed to focusing on a company's fundamentals and, as such, may not match with a report on a company's
fundamentals. Investors are advised to refer the Fundamental and Technical Research Reports available on our website to evaluate the
contrary view, if any
The information in this document has been printed on the basis of publicly available information, internal data and other reliable
sources believed to be true, but we do not represent that it is accurate or complete and it should not be relied on as such, as this
document is for general guidance only. Angel Broking Limited or any of its affiliates/ group companies shall not be in any way
responsible for any loss or damage that may arise to any person from any inadvertent error in the information contained in this report.
Angel Broking Limited has not independently verified all the information contained within this document. Accordingly, we cannot
testify, nor make any representation or warranty, express or implied, to the accuracy, contents or data contained within this document.
While Angel Broking Limited endeavors to update on a reasonable basis the information discussed in this material, there may be
regulatory, compliance, or other reasons that prevent us from doing so.
This document is being supplied to you solely for your information, and its contents, information or data may not be reproduced,
redistributed or passed on, directly or indirectly.
Neither Angel Broking Limited, nor its directors, employees or affiliates shall be liable for any loss or damage that may arise from or in
connection with the use of this information.
Disclosure of Interest Statement
Cadila Healthcare
1. Financial interest of research analyst or Angel or his Associate or his relative
No
2. Ownership of 1% or more of the stock by research analyst or Angel or associates or
No
relatives
3. Served as an officer, director or employee of the company covered under Research
No
4. Broking relationship with company covered under Research
No
Ratings (Based on expected returns
Buy (> 15%)
Accumulate (5% to 15%)
Neutral (-5 to 5%)
over 12 months investment period):
Reduce (-5% to -15%)
Sell (< -15)
March 25, 2019
9